Power BI Visual - Heatmap3
Heatmap Custom Visual for Microsoft Power BI
powerBI-visual-Heatmap3
Power BI custom visual showing a day of week, hour of day heatmap

![]()


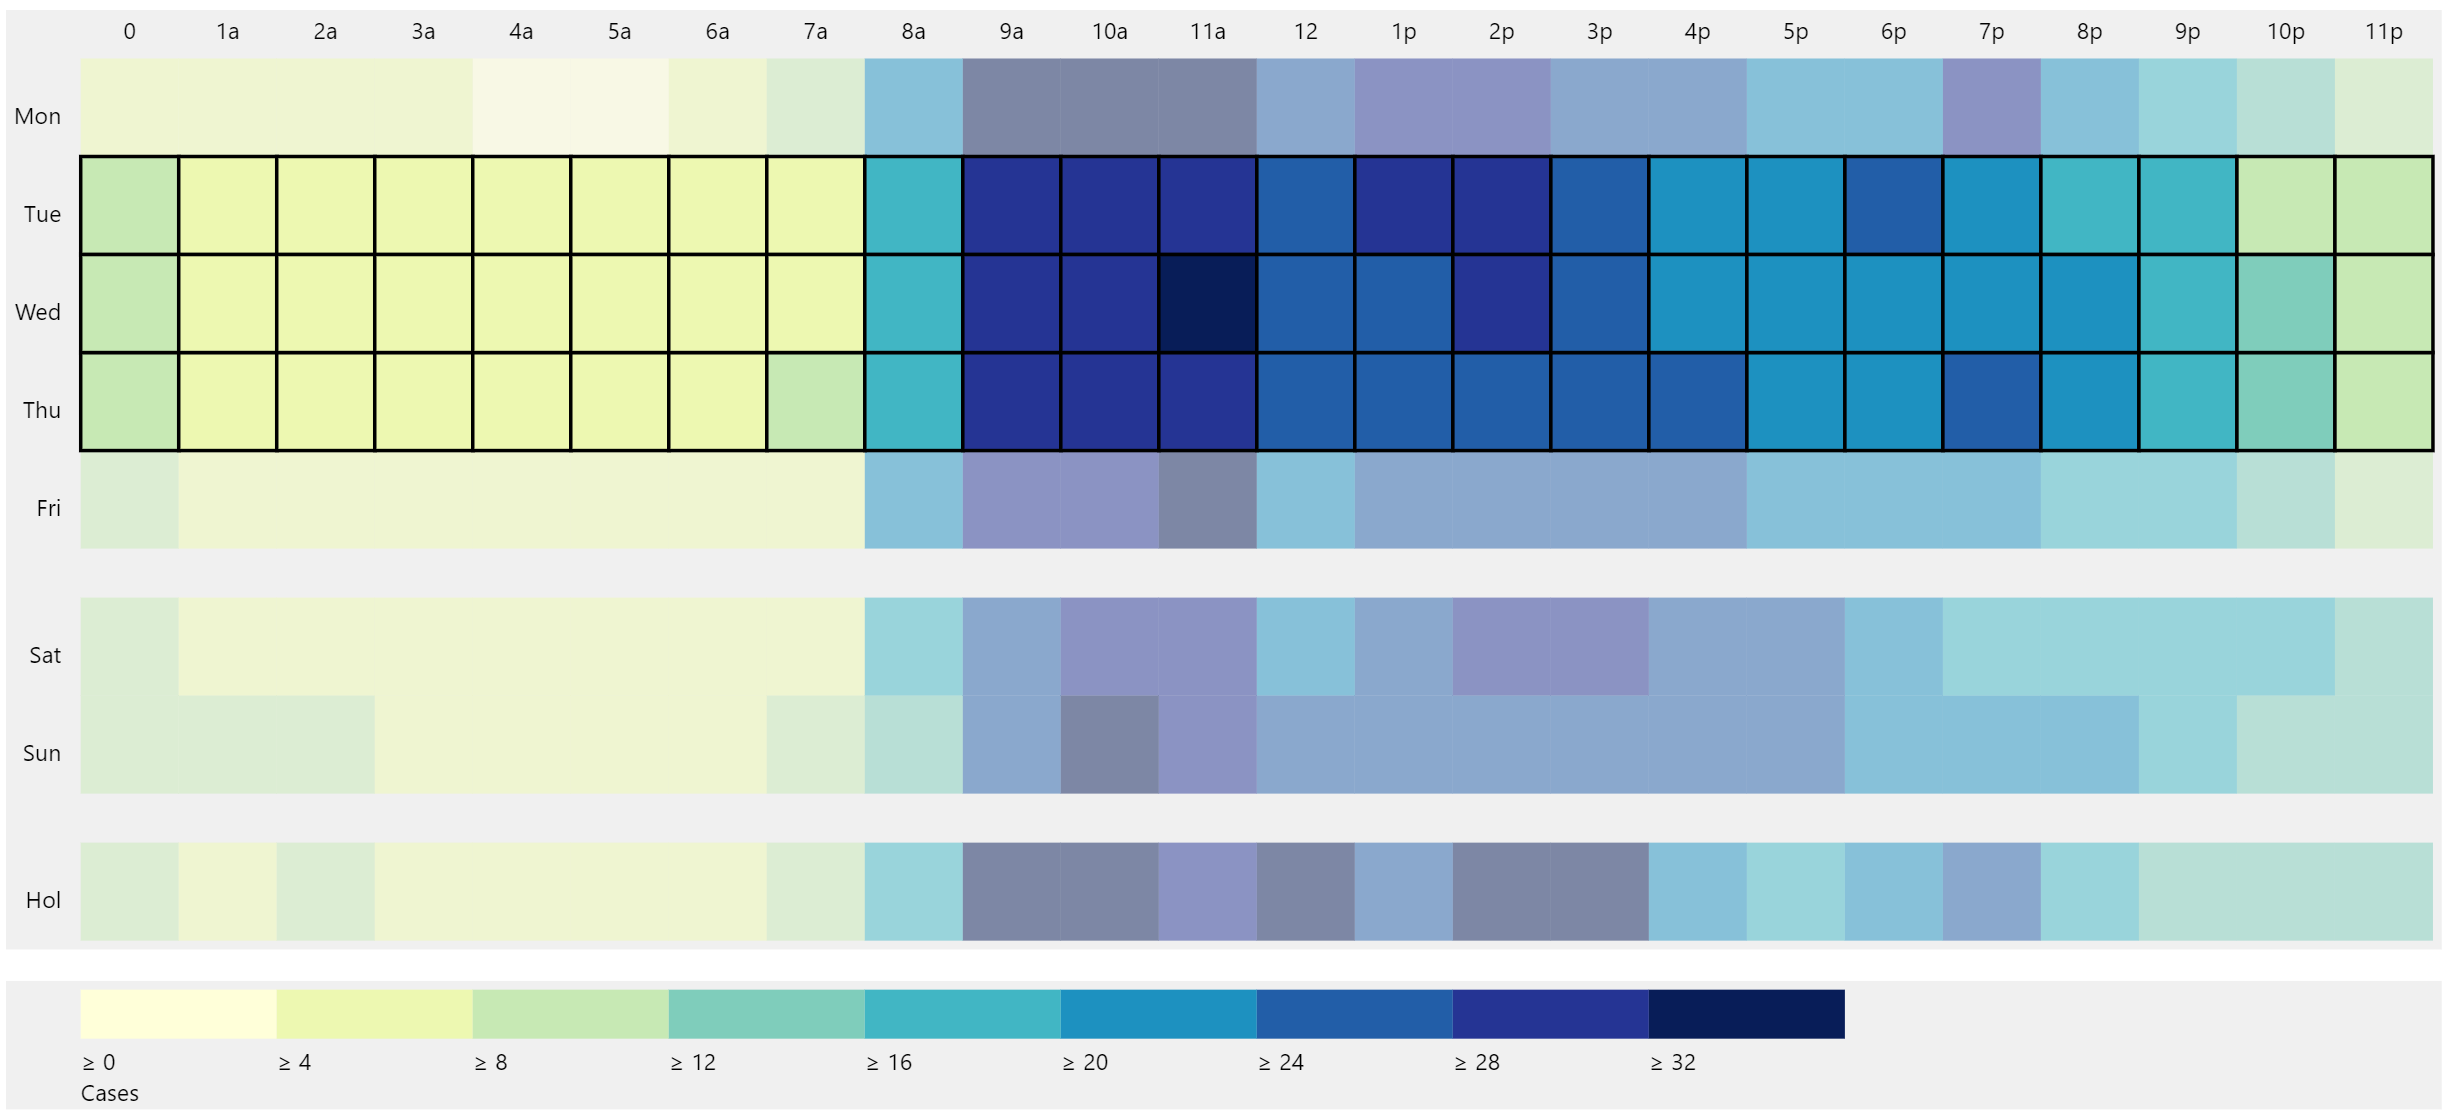
This custom visual for Microsoft Power BI displays a day of week, hour of day heatmap. The chart is a specific case of the generalised two dimensional heatmap where data is ordered by days and time of day. The visual supports:
- Display of data by working days, weekends and bank holidays
- Arrangement of time of day according to twenty four hour clock
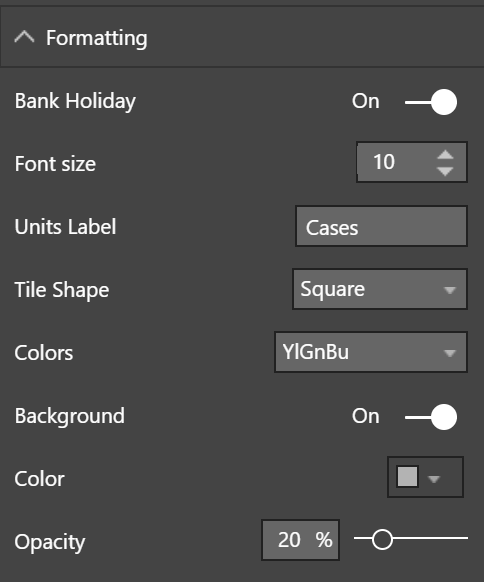
- Choice of background colours
- Choice of colour schemes for data
- Selectable data points. Multiple selections can be made by holding down the ctrl key. Entire rows and columns can be selected by clicking on the row and column labels.
Configuration Options
Sample data is included within the Sample Data folder.